5. Analysis: (A, μ) --> (μs, g) |
Previous page | Next page | Table of Contents
A simple analytic expression was developed to approximate the behavior of the data, SIGNAL(zf). The expression is:
SIGNAL = MEASUREMENT/Po = μs Lfocus f exp(-a μs zf 2 G)
where
- Po = total power delivered by confocal microscope [W].
The experiment also measured the reflectivity from a water/glass interface to allow calibration of the MEASUREMENT of reflected power. Hence, the term Po was accounted for. The MEASUREMENT was normalized by Po to yield the SIGNAL data reported here. Hence Po is not included in the analysis.
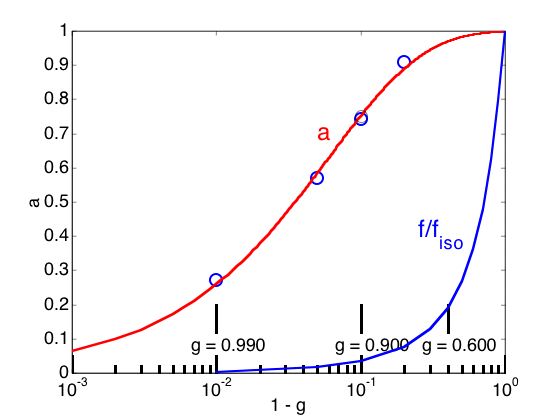
- a = function of the anisotropy of scattering, g, which diminishes the effectiveness of the scattering coefficient μs [dimensionless].
For isotropic scattering (g = 0), a(g) = 1. As scattering becomes forward-directed (g < 0), a(g) drops toward zero.
The function a(g) was determined by Monte Carlo simulations of the transport of light to the focus as a function of g and zf,
A exp(-μs zf a G)
which omits the effect of f since this describes transport TO the focus, not backscatter FROM the focus.
- μs = scattering coefficient [cm-1]
- Lfocus = axial length of the focal volume in the tissue over which the transported fluence is scattered.
This is an approximation, which used Lfocus = the distance between zero points in the axial Airy function (0.8 μm). This region is expected to dominate the scattering process.
- f = function of g, which describes the fraction of light undergoing scattering that backscatters within the cone of collection of the lens system of the confocal microscope to yield observed reflectance.
The behavior of f(g) was determined by integrating the Henyey-Greenstein scattering function over the solid angle of collection of the lens aperture (half angle = 0-42 ° for NA=0.90 water-immersion lens). If g is close to 0, the value of f is maximum due to strong backscatter. As g drops and light becomes forward-directed, the value of f drops rapidly.
- 2 = the factor that accounts for the double pass IN/OUT of the tissue, as light propagtes down to the confocal volume then backscatters to the surface for collection.
- G = the geometrical factor that describes the increased average photon pathlength from the surface to the focus since the light is delivered as a focused Gaussian beam rather than as a narrow collimated beam orthogonal to the surface. The value of G varies with the numerical aperture of the lens used in the experiment. In our case, the value of G was 1.15.
The figure below shows the behavior of a(g) and f(g), based on Monte Carlo simulations for a, and on integrtion of the Henyey-Greenstein scattering fucntion for f.
The behavior of f is expressed as f/fiso, i.e. normalized by the value of f for isotropic scattering, to allow plotting on the same graph.

A water-immersion lens was used, and this analysis has neglected the slight effect of the water-tissue refractive index mismatch.
Previous page | Next page | Table of Contents
