Previous page | Next page | Table of Contents
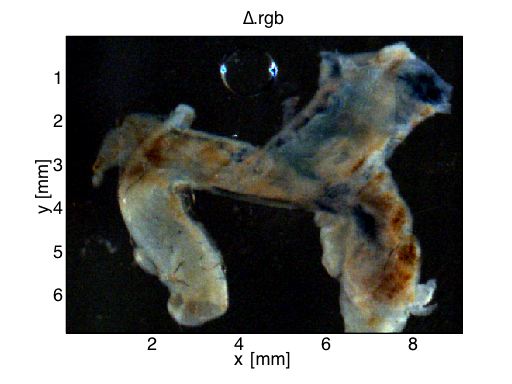
The PAR - PER RGB difference image shows regions that appear red and regions that appear blue. These colors may arise from differences in the ultrastructure of the tissue sample and from differences in thickness of the sample.

Figure: Excised mouse esophagus in buffered saline between glass coverslips. A close-up of the PAR - PER RGB difference image.