Previous page | Next page | Table of Contents
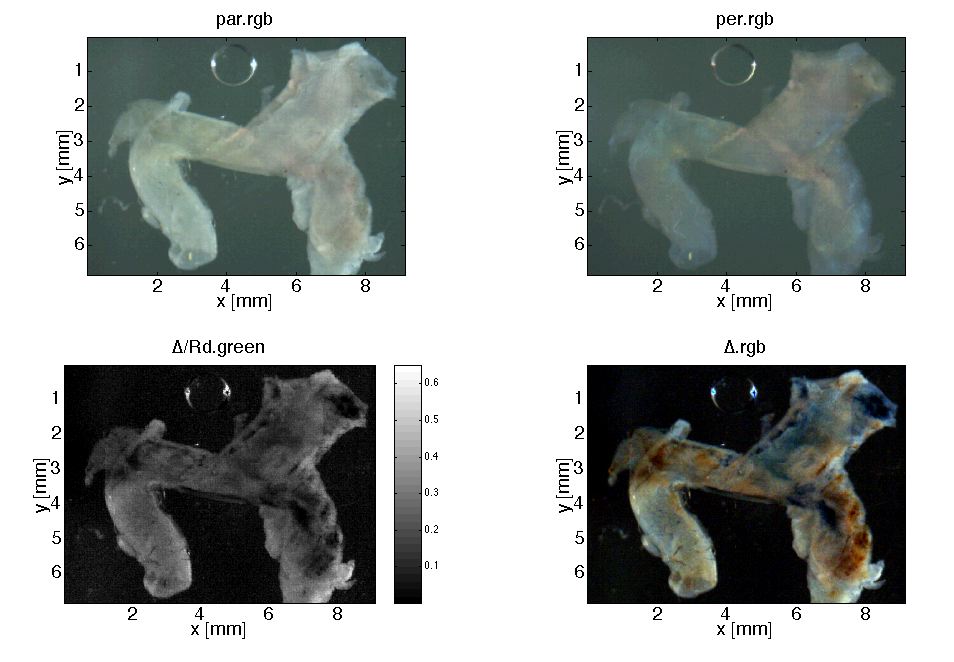
The images of the excised mouse esophagus are shown in the following figure. The PAR and PER images are shown to illustrate their similarity. The PAR image was a little brighter since co-polarized singly (or few) scattered illumination photons were accepted. The (PAR - PER)/PAR for the green channel is shown. Finally, the PAR - PER image is shown as an RGB image (see next page for close-up).
Figure: Excised mouse esophagus in buffered saline between glass coverslips. Upper left: PAR image. Upper right: PER image. Lower left: (PAR - PER)/PER for the green channel, scale = 0 to 0.65. Lower right: PAR - PER as RGB image (see next page).