Fluorescence lifetime imaging creates images on the basis of how long fluorescence persists once a fluorophore is excited. Two approaches toward lifetime measurements are possible:
- Time-resolved measurements
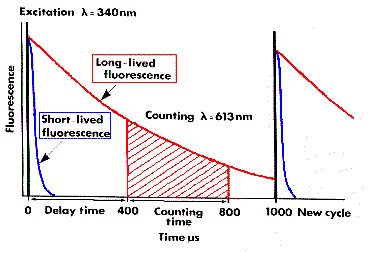
Following excitation by a pulsed laser source, an image can be acquired by a time-gated acquisition system. Acquiring a series of images with varying time delays before image acquisition creates a data base from which a fluorescence lifetime image can be reconstructed.
- Frequency-domain measurements
Using a modulated light source for excitation (eg., 100 MHz modulation frequency), images can be acquired using a video camera with an intensifier stage whose gain is modulated at either the same frequency (homodyne detection) or at a slightly different frequency (heterodyne detection, eg., 100.001000 MHz). Hence, the intensifier stage acts as a homodyne or heterodyne detector and the phase and modulation of the fluorescence at each pixel are acquired.
The above measurements can be analyzed to reconstruct the internal spatial distribution of fluorescence lifetime and fluorescence yield.
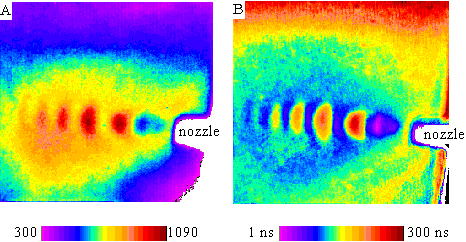
Imaging a shock wave generated by high pressure nozzle.
The images compare time-resolved and fluorescence lifetime imaging.

Shock wave imaged with time resolved camera and pressure sensitive paint. (A) intensity map (arbitrary units).(B) lifetime map (nanoseconds).
Courtesy of Dr. Ram Levy, McDonnell-Douglas Research Laboratories. Image posted by Laboratory for Fluorescence Dynamics at the University of Illinois at Urbana-Champaign (Enrico Gratton) at link.
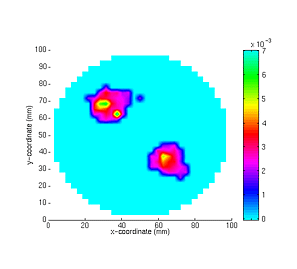
Mapping fluorescence yield in a turbid medium.

A reconstructed spatial map of fluorescence yield, on a two-dimensional, 33 x 33 grid. The object locations and sizes are recovered correctly.
Image posted by The Photon Migration Laboratory, School of Chemical Engineering, Purdue University (Eva Sevick) at link.
The computer simulated the optics of two fluorescent objects within a turbid medium. The computer simulated frequency-domain measurements of fluorescence at the boundaries. Finally, the computer reconstructed the internal map of fluorescence lifetime and yield. This image shows the map of fluorescence yield, and is NOT a lifetime image.
Time-resolved measurement of fluorescence lifetime.

Time-resolved measurement of fluorescence lifetime. Two fluorophores are compared, one with a short fluorescence lifetime and one with a long lifetime.
Image posted by Regensburg University, Institute of Analytical Chemistry, Chemo- and Biosensors (Otto Wolfbeis) at link, and the center's home page is at Regensburg Univ..
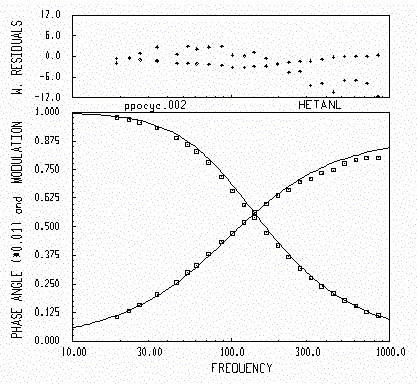
Frequency-domain measurement of fluorescence lifetime

The phase and modulation of fluorescence are plotted as functions of the modulation frequency of the excitation source. As the frequency increases beyond the ability of the fluorophore to respond, i.e., when the fluorophore lifetime is long compared to the time period of source modulation, then the modulation decreases. As the frequency increases, phase increases because more cycles can distribute along the average photon path between source and detector. In this example, the midpoint frequency is about 100 MHz.
Image posted by The Center for Fluorescence Spectroscopy (Joseph Lakowicz) at link, and the center's home page is at CFS.
NewsEtc. Contents page
OMLC home page