 This page summarizes the optical absorption and emission data of Bilirubin that
is available in the PhotochemCAD
package, version 2.1a (Du 1998, Dixon 2005). I reworked their data to
produce these interactive graphs and to provide direct links to text files
containing the raw and manipulated data. Although I have tried to be careful, I
may have introduced some errors; the cautious user is advised to compare these
results with the original sources.
This page summarizes the optical absorption and emission data of Bilirubin that
is available in the PhotochemCAD
package, version 2.1a (Du 1998, Dixon 2005). I reworked their data to
produce these interactive graphs and to provide direct links to text files
containing the raw and manipulated data. Although I have tried to be careful, I
may have introduced some errors; the cautious user is advised to compare these
results with the original sources.
You can resize any of the graphs by clicking and dragging a rectangle. If you hover the mouse over the graph, you will see a pop-up showing the coordinates. One of the icons in the upper right corner will let you export the graph in other formats.
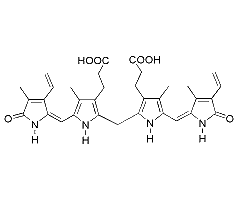
Absorption
This optical absorption measurement of Bilirubin were made by J. Li on 12-11-1997 using a Cary 3. The absorption values were collected using a spectral bandwidth of 1.0 nm, a signal averaging time of 0.133 sec, a data interval of 0.25 nm, and a scan rate of 112.5 nm/min.
These measurements were scaled to make the molar extinction coefficient match the value of 55,000cm-1/M at 450.8nm (Agati, 1990).
Original Data | Extinction Data
Notes
A fluorescence quantum yield of 0.1 was observed in an EPA glass at 77 K (Cu, 1975).References
Agati, G. and F. Fusi (1990) New trends in photobiology recent advances in bilirubin photophysics. J. Photochem. Photobiol. 7, 1-14.
Cu, A., G. G. Bellah and D. A. Lightner (1975) On the fluorescence of bilirubin. J. Am. Chem. Soc. 97, 2579-2580.
Dixon, J. M., M. Taniguchi and J. S. Lindsey (2005), "PhotochemCAD 2. A Refined Program with Accompanying Spectral Databases for Photochemical Calculations, Photochem. Photobiol., 81, 212-213.
Du, H., R.-C. A. Fuh, J. Li, L. A. Corkan and J. S. Lindsey (1998) PhotochemCAD: A computer-aided design and research tool in photochemistry. Photochem. Photobiol. 68, 141-142.