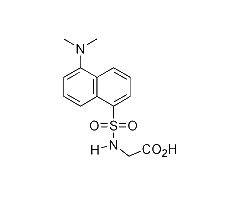
 This page summarizes the optical absorption and emission data of Dansyl glycine that
is available in the PhotochemCAD
package, version 2.1a (Du 1998, Dixon 2005). I reworked their data to
produce these interactive graphs and to provide direct links to text files
containing the raw and manipulated data. Although I have tried to be careful, I
may have introduced some errors; the cautious user is advised to compare these
results with the original sources.
This page summarizes the optical absorption and emission data of Dansyl glycine that
is available in the PhotochemCAD
package, version 2.1a (Du 1998, Dixon 2005). I reworked their data to
produce these interactive graphs and to provide direct links to text files
containing the raw and manipulated data. Although I have tried to be careful, I
may have introduced some errors; the cautious user is advised to compare these
results with the original sources.
You can resize any of the graphs by clicking and dragging a rectangle. If you hover the mouse over the graph, you will see a pop-up showing the coordinates. One of the icons in the upper right corner will let you export the graph in other formats.
Absorption
This optical absorption measurement of Dansyl glycine were made by R.-C. A. Fuh in the summer of 1997 using a Cary 3. The absorption values were collected using a spectral bandwidth of 1.0 nm, a signal averaging time of 0.133 sec, a data interval of 0.25 nm, and a scan rate of 112.5 nm/min.
These measurements were scaled to make the molar extinction coefficient match the value of 4,300cm-1/M at 327.2nm (Chen, 1968).
Original Data | Extinction Data
Notes
We were unable to record a fluorescence spectrum, thus no file is included.References
Bramhall, J. (1986) Phospholipid packing asymmetry in curved membranes detected by fluorescence spectroscopy. Biochemistry 25, 3479-3486.
Chen, R. F. (1968) Dansyl labeled proteins: Determination of extinction coefficient and number of bound residues with radioactive dansyl chloride. Anal. Biochem. 25, 412-416.
Dixon, J. M., M. Taniguchi and J. S. Lindsey (2005), "PhotochemCAD 2. A Refined Program with Accompanying Spectral Databases for Photochemical Calculations, Photochem. Photobiol., 81, 212-213.
Du, H., R.-C. A. Fuh, J. Li, L. A. Corkan and J. S. Lindsey (1998) PhotochemCAD: A computer-aided design and research tool in photochemistry. Photochem. Photobiol. 68, 141-142.