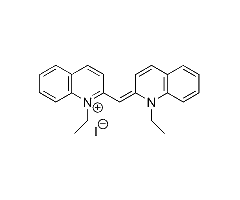
 This page summarizes the optical absorption and emission data of 1,1'-diethyl-2,2'-cyanine iodide that
is available in the PhotochemCAD
package, version 2.1a (Du 1998, Dixon 2005). I reworked their data to
produce these interactive graphs and to provide direct links to text files
containing the raw and manipulated data. Although I have tried to be careful, I
may have introduced some errors; the cautious user is advised to compare these
results with the original sources.
You can resize any of the graphs by clicking and dragging a rectangle. If you hover the mouse over the graph, you will see a pop-up showing the coordinates. One of the icons in the upper right corner will let you export the graph in other formats.
Absorption
This optical absorption measurement of 1,1'-diethyl-2,2'-cyanine iodide were made by R.-C. A. Fuh in the summer of 1997 using a Cary 3. The absorption values were collected using a spectral bandwidth of 1.0 nm, a signal averaging time of 0.133 sec, a data interval of 0.25 nm, and a scan rate of 112.5 nm/min.
These measurements were scaled to make the molar extinction coefficient match the value of 54,000cm-1/M at 524.2nm (Tredwell, 1979).
Original Data | Extinction Data
Notes
Due to the expected low fluorescence yield, estimated to be 0.001 (Tredwell, 1979), a fluorescence spectrum was not collected.References
Dixon, J. M., M. Taniguchi and J. S. Lindsey (2005), "PhotochemCAD 2. A Refined Program with Accompanying Spectral Databases for Photochemical Calculations, Photochem. Photobiol., 81, 212-213.
Du, H., R.-C. A. Fuh, J. Li, L. A. Corkan and J. S. Lindsey (1998) PhotochemCAD: A computer-aided design and research tool in photochemistry. Photochem. Photobiol. 68, 141-142.
Tredwell, C. J. and C. M. Keary (1979) Picosecond time resolved fluorescence lifetimes of the polymethine and related dyes. Chem. Phys. 43, 307-316.