Slide 11/13
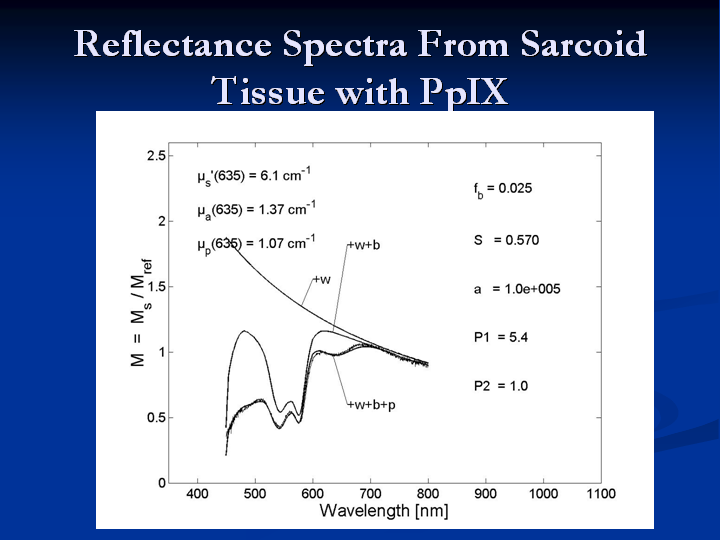
The reflectance spectra taken of the tissue are then fit to scattering and a linear combination of the absorption spectra found in the tissue. In this figure the +w+b+p is the fit to the data including the water, blood and PpIX. The +w+b line is what the spectra would look like if the PpIX was not in the tissue. The +w is what the spectra would look like if the blood were also not in the tissue.
previous slide | next slide | index