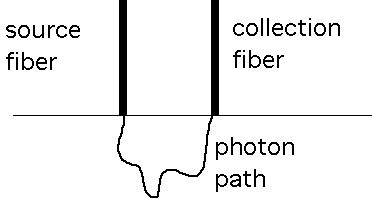
Consider a simple optical fiber spectrometer.
Fig. 1a: Two fibers, one source and one collector, contacting a tissue surface. The source is white light, and the collector returns light to a spectroscopic detector. The source has a spectral density [W/nm] and the spectroscopic detection system has a bandwidth of detection [nm], so the power delivered and collected for each bin of the spectrometer is [W/nm][nm] = [W].
Light is delivered through one optical fiber (the "source") at a power Po [W].
The transport, T [1/cm2], of light describes the diffusion of light from the source fiber to a "collection" fiber. The fluence rate, F [W/cm2], at the collection fiber is calculated:
![]()
The value of T depends on the distance between the source and collection fibers, the optical properties of the tissue, and the refractive index mismatch at the surface boundary. When working with two closely spaced fibers (or a single fiber that both delivers and collects light), one must use Monte Carlo simulations to calculate the value of T. When fibers are spaced more than a few mm apart, the value of T can be calculated by simple diffusion theory.