May 2, 2006, Steven Jacques
This webpage is based on work done at the Univ. of Texas M.D. Anderson Cancer Center, and reported in a conference paper. That paper was lost long ago, yet I continue to get requests for the data. So here is a brief summary of the basic lesson from that paper. ...sorry the original paper is not available.
Jacques, S.L., C. Newman, X.Y. He:
Thermal coagulation of tissues: Liver studies indicate a distribution of rate paramters
not a single rate parameter describes the coagulation process.
Proceedings of the Annual Winter Meeting of
the American Society of Mechanical Engineers, Atlanta, GA, 1991.
METHOD: Samples of pig liver were sliced into about 2-mm thicknesses and wrapped in aluminum foil. The wrapped samples were placed in a heated water bath for various times, up to 2 hr. Three temperatures were tested (roughly 45, 55, 60 °C I believe). After exposure to constant temperature some particular exposure time, the samples were removed and the optical properties measured using an integrating sphere (measure transmission and reflectance to specify absorption and reduced scattering).
RESULTS: The reduced scattering increased with coagulation. Figure 1 shows the approximate results, as best I can remember them. The exposure time for 50% coagulation versus exposure temperature yielded values of ∆S = 553.5 J/mole/K and ∆H = 2.768x10⁵ J/mole. This transition is shown as a RED LINE in Fig. 1. But the actual data was more spread out than predicted by the Arrhenius rate process for a single transition with these ∆S and ∆H values. Coagulation began about 10x faster and completed about 10x slower than expected. This transition is shown as a BLUE LINE in Fig. 1. The blue line was obtained by considering a series of coagulations, each with a different rate constant k, and each coagulation contributed an equal increment in the reduced scattering coefficient. Hence, the transition was spread out. It was also observed that the final amount of increased scattering obtained was the same for the three temperatures tested. In other words, the final fully coagulated state behaved as a proper state variable that was independent of the path taken to achieve that state.
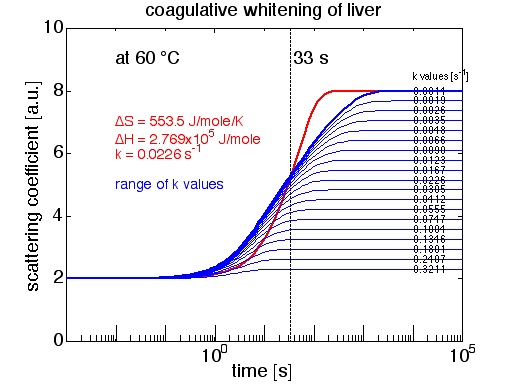
Figure 1: Coagulation of liver yielded an increase in optical scattering (the reduced scattering coefficient, µs' = µs(1-g)). The y-axis in this figure is in ARBITRARY UNITS, because the original data is not available. So ignore the units on the y-axis.
The RED LINE is the thermal transition from native to denatured using a single rate constant (k = 0.0226 s-1). The BLUE LINE is the thermal transition from native to denatured using a series of rate constants (k values listed at right), where each transition contributes a little to the overall cumulative change in scattering. Thin blue lines show the contribution from each of the transitions, and the thick blue line shows the cumulative effect.
DISCUSSION: The tentative conclusion is that coagulation of various structures in the liver contribute to the cumulative change in scattering that causes the liver to whiten. Each structure has a different rate constant (k) for denaturation leading to aggregation that causes increased scattering. The nature of the different structures is unknown, and they may simply be the same structure with different amounts of cooperative bonds holding the structure together. More work on tissue coagulation should be done.