NOTE: This analysis is an update of the previous webpage (see Feb 2006).
Spectroscopic determination of tissue optical properties using optical fiber spectrometer.Steven L. JacquesBiomedical Engineering and Dermatology |
The strategy is to predict the measurement M using theory based on choices of
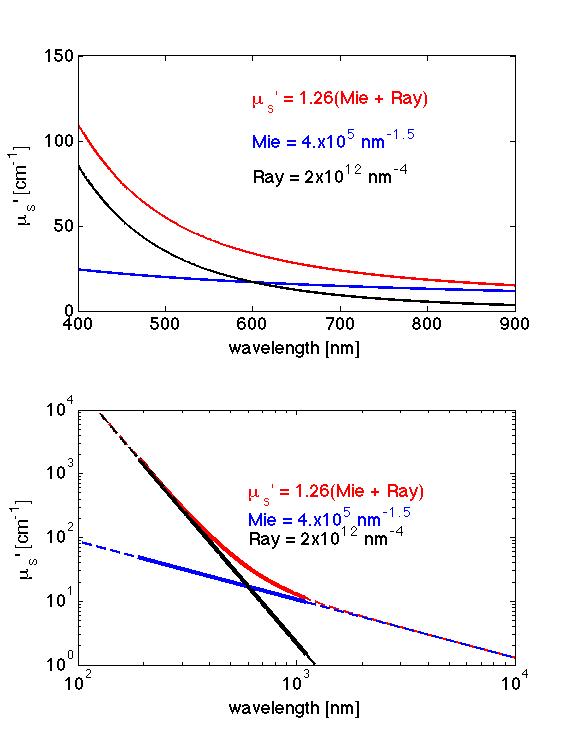
In this model, the known behavior of skin scattering was used, which is a combination of Mie scattering and Rayleigh scattering. This behavior was obtained from experimental work on rats, human adults, and human neonates, which all had the same scattering behavior versus wavelength, although the amplitude of this scattering slightly varied. The fitting scales the magnitude of this scattering, but the ratio of Mie to Rayleigh, and their respective spectral shapes were fixed.
The epidermal melanin (Mel) was used to specify the volume fraction of melanosomes in a 60-µm-thick epidermis, a thickness which is used as a convention. The spectrum muamel is the absorption coefficent of the interior of a melanosome*. The photon path (Lepi) within the epidermis due to photons entering and leaving the skin (i.e., IN/OUT) equals 2 x 60-µm or 0.0120 cm. The epidermis is so thin that the factor MLepi is not separable. So the assumption of Lepi = 0.0120 cm is not critical, but is a convention used in this analysis. The role of total internal reflectance at the air/skin surface, which would allow multiple passes through the epidermis, is a real but modest effect and is ignored here.
* Jacques SL, DJ McAuliffe: The melanosome: threshold temperature for explosive vaporization and internal absorption coefficient during pulsed laser irradiation. Photochem Photobiol 53:769-776, 1991
The factor CONST is a factor that equals RstdGstd/Gskin, where
Rstd = reflectance of standard (= 0.997 for spectralon)
Gstd = fraction of reflectance from standard collected by fiber
Gskin = fraction of reflectance from skin collected by fiber
The measurement of the white standard involved measuring the standard from a distance, holding the fibar about 5 cm above the surface of the standard, to correct for the color temperature of the light source and the wavelength-dependent sensitivity of the detector. So it encoded the spectral shape but not the absolute value of reflectance. While the value of Rstd was known to be 0.997 (spectralon), the value of collection efficiency Gstd was unknown. The value of Gskin was not known, although it should be about 0.15 since only light that escapes within the numerical aperture of the optical fiber will reach the detector. There is a slight wavelength dependence to Gskin, due to how optical properties influence the G measured by an optical fiber*, that is ignored here. Hence, the term RstdGstd/Gskin is summarized by a single wavelength-independent factor CONST. The fitting will lock onto the spectral shape of the data, while CONST accounts for the absolute value of the fitting.
* PR Bargo, SL Jacques, R Sleven, T Goodell, Optical properties effects upon the collection efficiency of multifiber probe configurations, IEEE J. Selected Topics in Quantum Electronics 9:314-321, 2003 * Paulo R. Bargo, Scott A. Prahl, and Steven L. Jacques, Collection efficiency of a single optical fiber in turbid media, Appl. Optics 42:3187-3197, 2003
The subroutine getRr(mua, musp, r, n) for source-detector fiber separation r = 0.2 cm and tissue refractive index n = 1.37, uses the optical properties of absorption (mua) and reduced scattering (musp) as a function of wavelength (nm). The subroutine used in this example is based on diffusion theory, although other subroutines can be used, such as a lookup table based on Monte Carlo simulations. The generic MATLAB code is:
Mie = 4.59e3*nm.^-0.913;
Ray = 1.74e12*nm.^-4;
musp = a*(Mie + Ray); % <---------- reduced scattering for generic skin

muamel = 6.6e11*nm.^-3.33; % cm^-1, absorption coeff. of interior of melanosome
Lepi  = 2*0.0060; % cm, assumed photon path within the epidermis during in/out
Tepi  = exp(-Mel*muamel*Lepi); % <---- in/out transmission of epidermal melanin

mua   = B*(S*muaoxy + (1-S)*muadeoxy) + W*muawater; % <-------- total absorption

r = 0.2; % cm, source-detector fiber separation
n = 1.4; % tissue refractive index

M = Mskin/Mstd;    % <======== the experimental measurement
pM = CONST*Tepi.*getRr(mua, musp, r, n); % <======== the predicted measurement
|
The algorithm for the analysis is listed in the following files which are text files in MATLAB format. Download .zip file
|
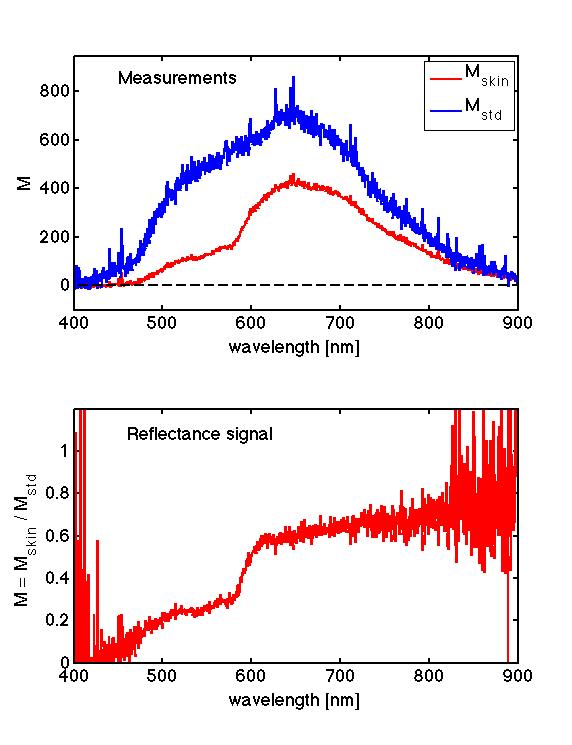
The skin and standard spectra used in this example are especially noisy and were generated by an
optical fiber spectrometer quickly assembled (about 30 min) for the purpose
of a classroom demonstration. Despite the noise, the analysis works ok.
The figures generated by the above programs are:
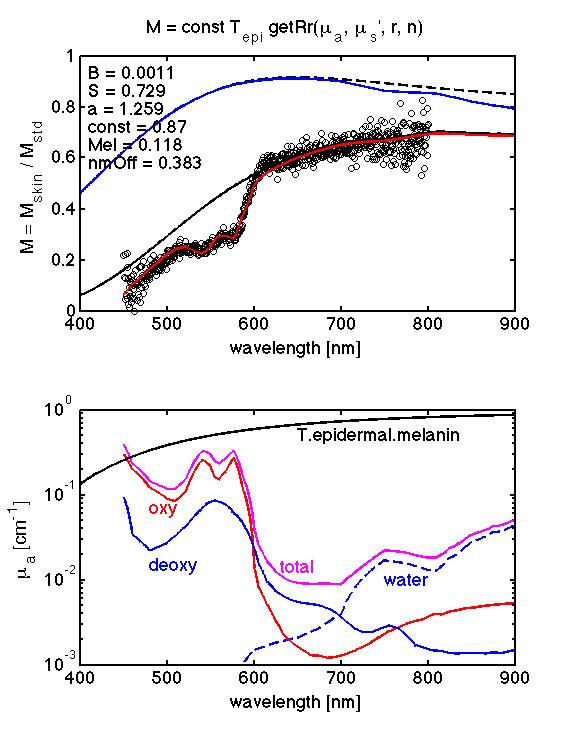
The fits in the MIDDLE figure (TOP) show:
(1) scattering only (black dashed line)
(2) scattering + water (blue line)
(3) the same as (2) with added epidermal melanin (solid black line), and
(4) the same as (3) with added blood (red line).
The numerical values for Blood (B), oxygen saturation (S), melanin (Mel), scattering strength (a), and the constant (const) are shown.
In addition, the program checks for an offset (nmOff) in the wavelength accuracy of the spectrometer (in this case not a problem).