© 1998 Steven L. Jacques, Scott A. Prahl
Oregon Graduate Institute

| ECE532 Biomedical Optics © 1998 Steven L. Jacques, Scott A. Prahl Oregon Graduate Institute |
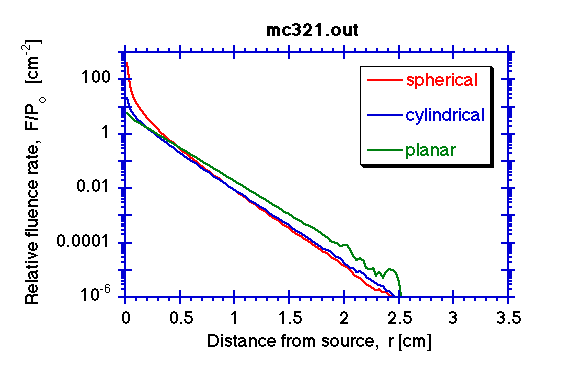
The computer program mc321.c produces the data displayed in the following figure. The relative fluence rate F/Po [cm-2], the fluence rate per W of source power Po from an isotropic point source at the origin, is plotted as a function of the distance from the source, r [cm]. The following figure shows data generated by launching 100,000 photons which required 5 min to run on a personal computer (G3 PowerMac). The optical properties were µa = 1 cm-1, µs = 100 cm-1, and g = 0.90.

The statistical noise becomes significant when F/Po has dropped to 0.0001 at about a 2-cm distance from the source.