6. Combine data and analysis |
Previous page | Next page | Table of Contents
The analytic analysis expression from the previous page indicates that the predicted behavior of reflectivity (ρ [dimensionless]) and attenuation (μ [cm-1]) is:
ρ ≈ μs Lfocus f
μ ≈ a μs zf 2 G
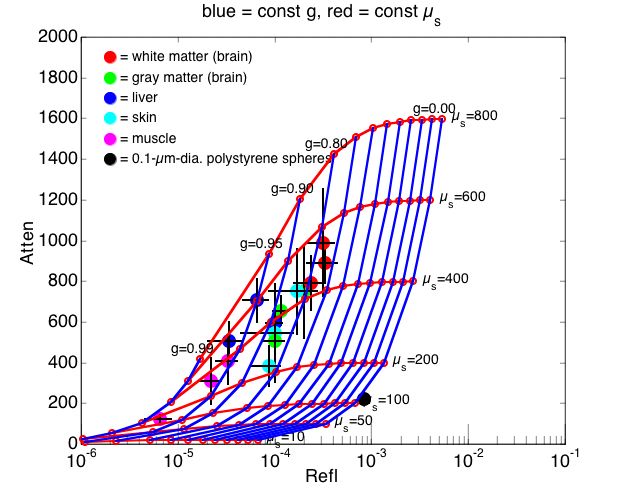
For a range of optical properties μs and g values, the predicted values of observed μ and ρ were generated and overlaid on the data as a grid.
The grid suggests that the optical properties of all the tissues are in the range of 300-600 cm-1, and the anisotropy g varies broadly from 0.90-0.99.
These preliminary results suggest that anisotropy g is a quite variable optical property that strongly influences the signals obtained in confocal microscopy.
An experimental measurement of an agarose gel containing 0.1-μm-diameter polystyrene microspheres (μs = 97 cm-1, g = 0.11, based on transmission experiments and Mie theory calculations) is shown (black solid circle) and properly locates near its predicted values of μs and g.
Previous page | Next page | Table of Contents