Slide 16/23
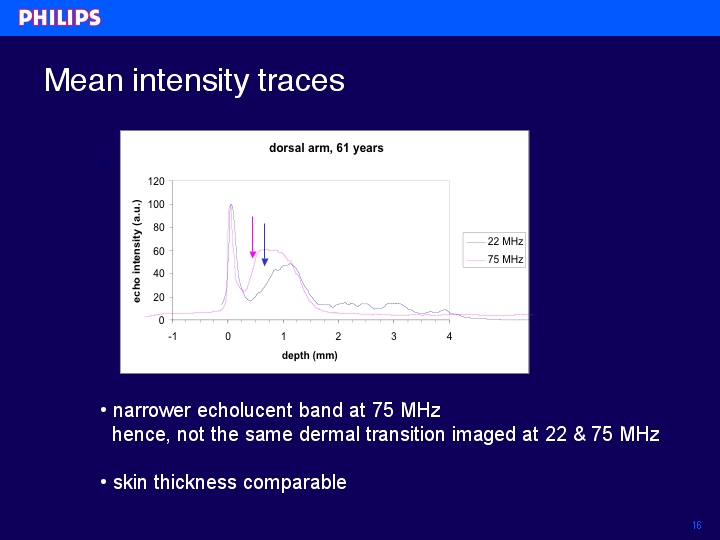
We have plotted the mean traces from the two images. In blue the 22 MHz and in magenta the 75 MHz signal is represented. The thickness of the skin measured by both frequencies is comparable. The traces show however, that the echo-lucent band is narrower when measured with the higher frequency of 75 MHz, as compared to the 22 MHz trace. This indicates that not the same dermal transition is imaged at 22 and 75 MHz.
index | previous | next