Free PDF available at http://iopscience.iop.org/0031-9155/58/11/R37
or at Jacques_PMB2013.pdf.
This webpage contains the data in Tables 1 and 2 that pertain to scattering , as well as the raw scattering spectra used to generate the tables, which were compiled from 56 references cited in the article.
Also, this webpage contains the data in Table 3 that pertain to tissue absorption properties.
This review did not cover all published data. The author continues to find both old and new references that should be added to this listing. (This task is planned.)
The data are available here in two formats:
Table 1: Parameters specifying the reduced scattering coefficient of tissues.
The data are listed as an array structure
   tissue(k) for k=1:56 citations, with fields:
   tissue(k).nm    = wavelengths [nm]
   tissue(k).musp  = reduced scattering coeff. [cm^-1]
   tissue(k).name  = tissue description
   tissue(k).ref   = reference cited
   tissue(k).type  = tissue type
   tissue(k).abafm = [a b aa fray bmie] (note: aa = a' in Eq. 2)
Table 2 "Average parameters for reduced scattering coefficient, mu_s [cm^-1], for tissues"
for i=1:7 --> skin, brain, breast, bone, soft, fibrous, fatty
   name(i).s = name of tissue type
   mn(i,:) = mean values of [a, b, aa, fray, bmie] (note: aa = a' in Eq. 2)
   sd(i,:) = std deviations
   nn(i,:) = number of cited values averaged
Table 3: In vivo tissue parameters governing optical absorption.
in struct array tissue(1:47) with fields:
  tissue(i).ref = cited reference
  tissue(i).HGb = concentration HGb [uM]
  tissue(i).B   = % blood volume fraction
  tissue(i).S   = % HGb oxygen saturation
  tissue(i).W   = % water volume fraction
  tissue(i).F   = % fat voume fraction
  tissue(i).M   = % melanosome vol.fraction in 60um epidermis
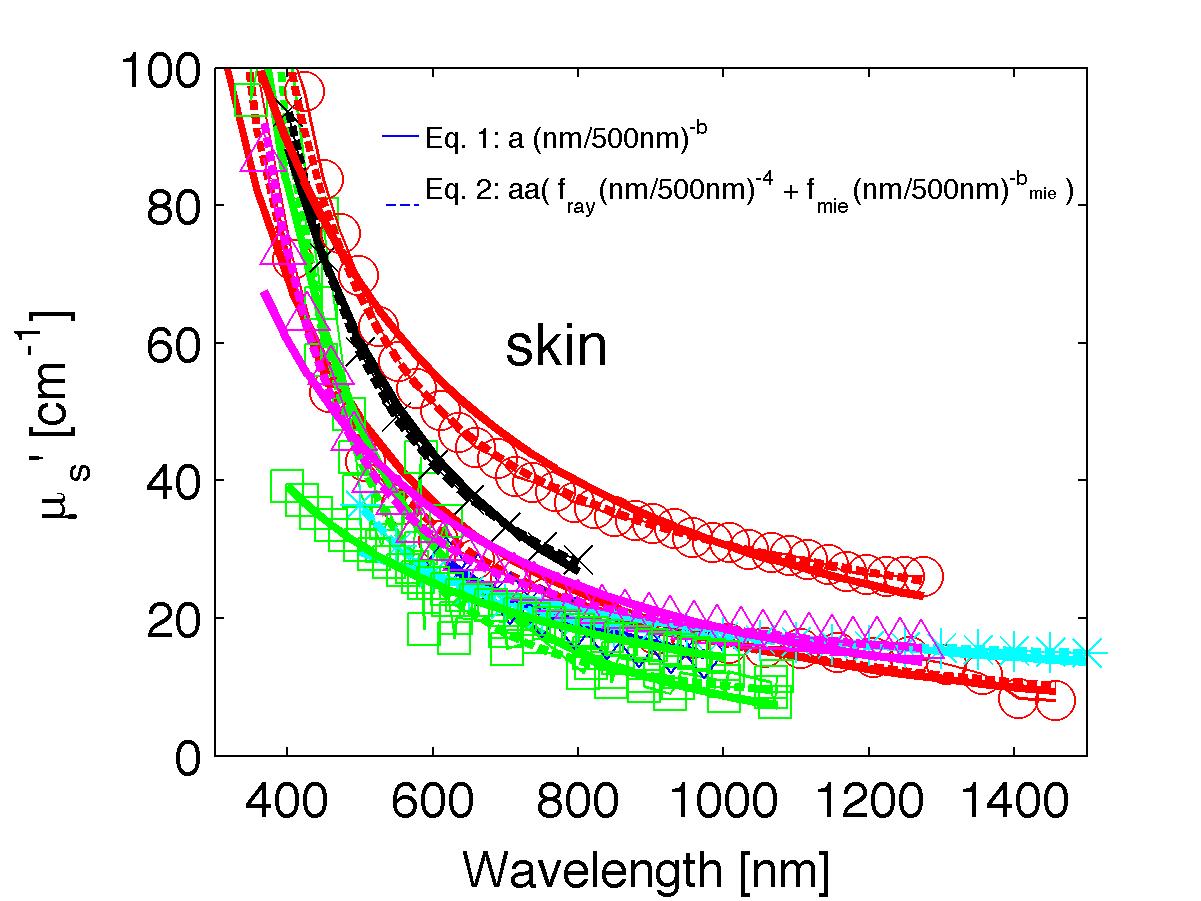
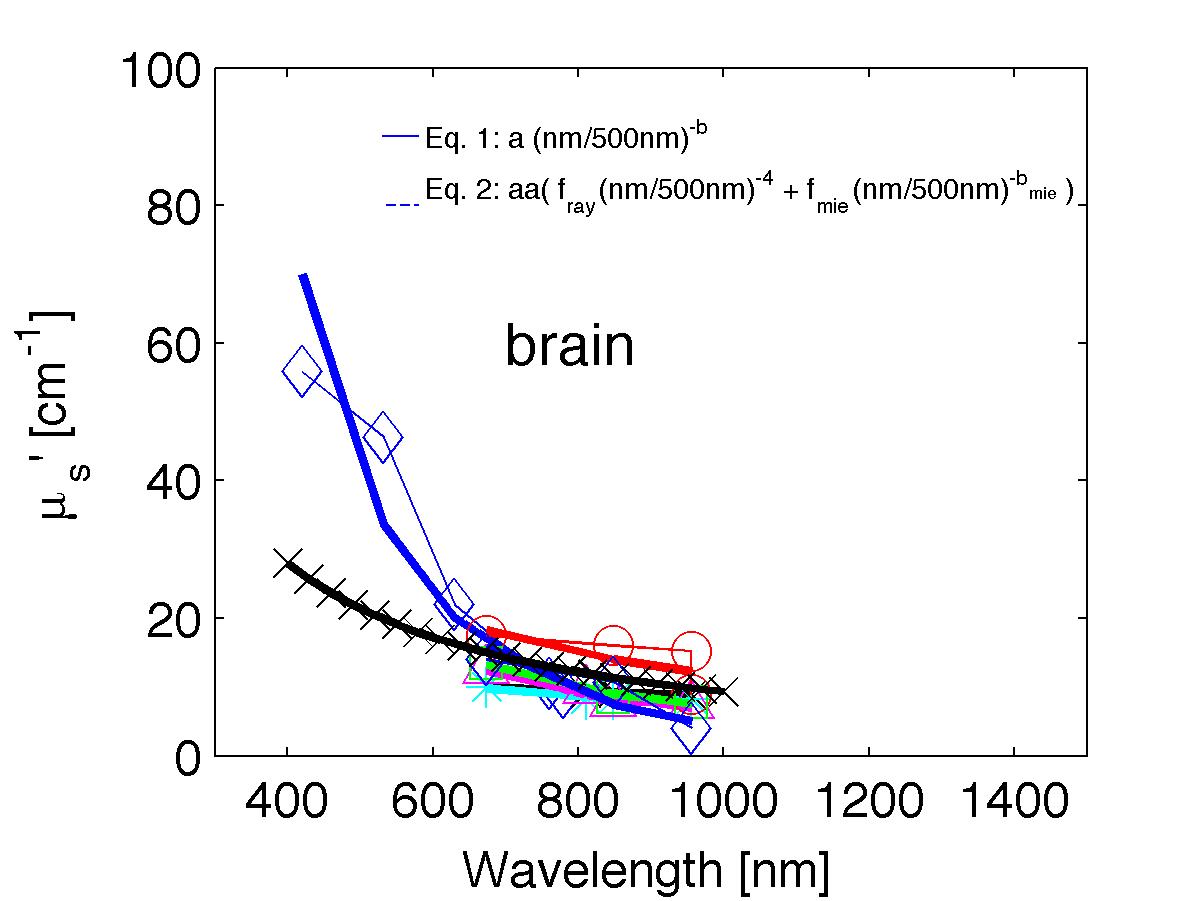
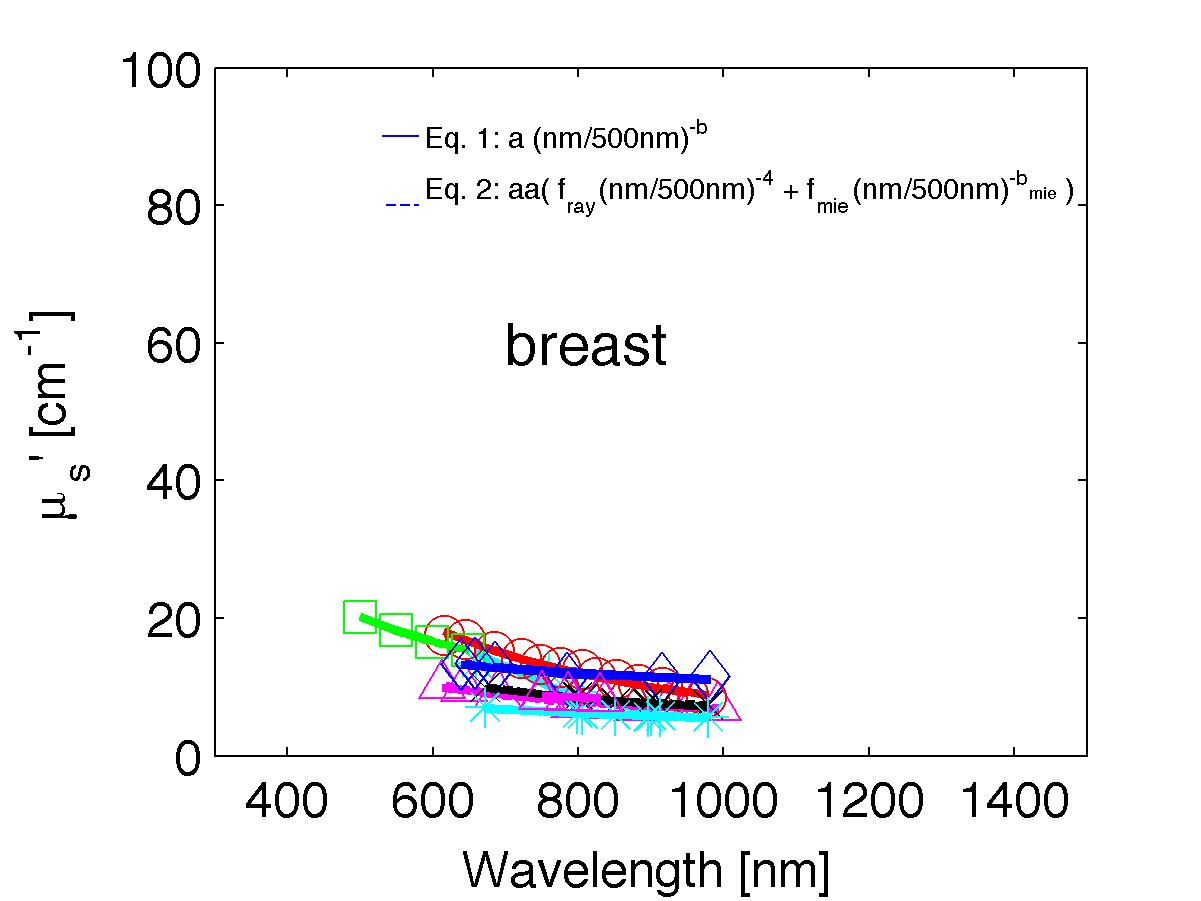
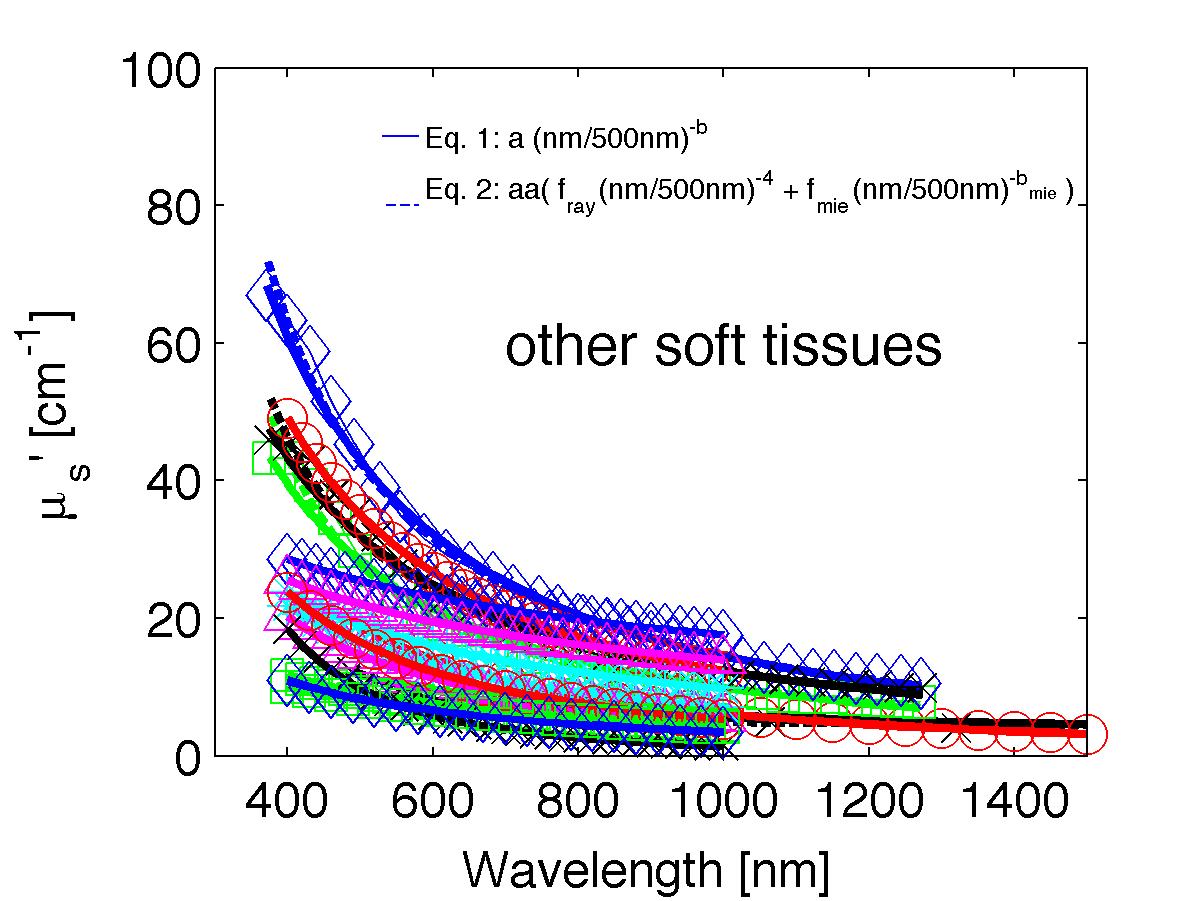
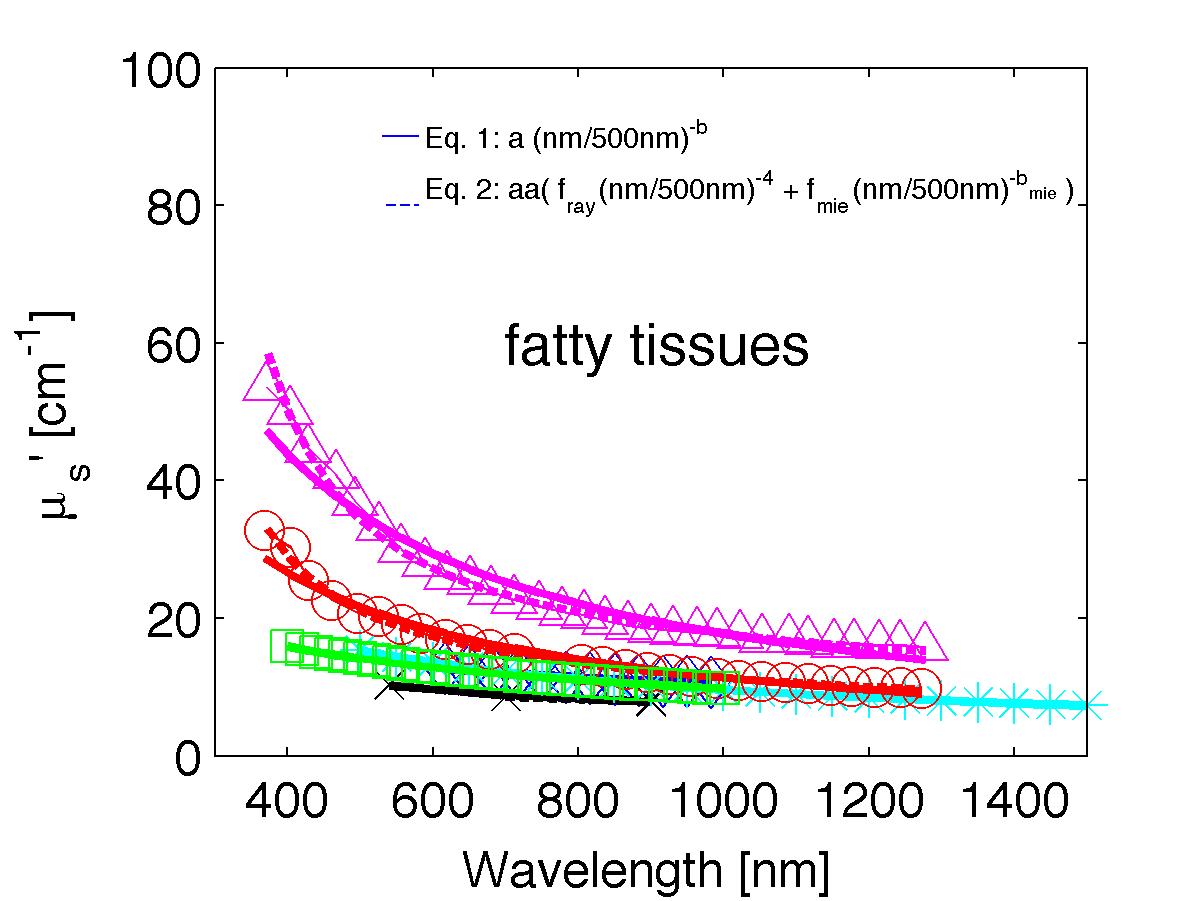
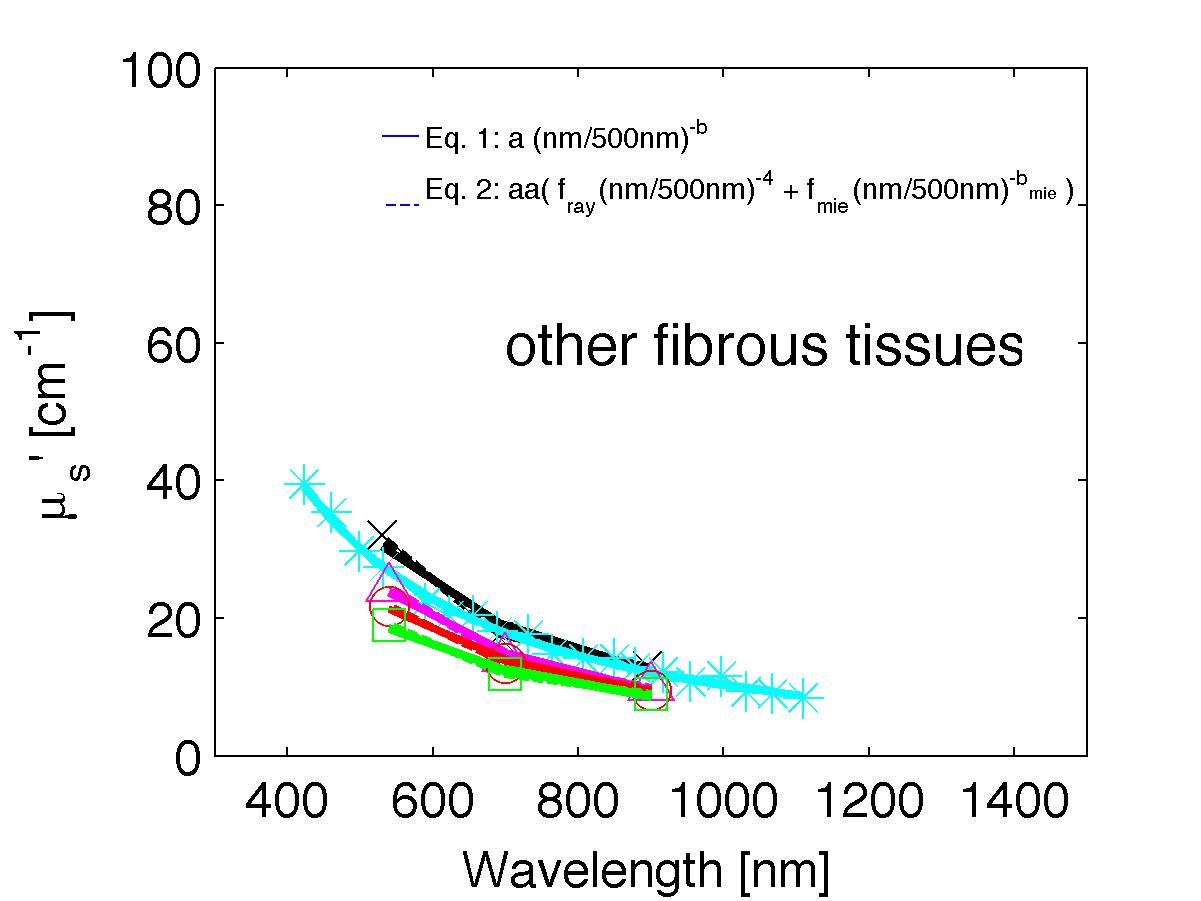
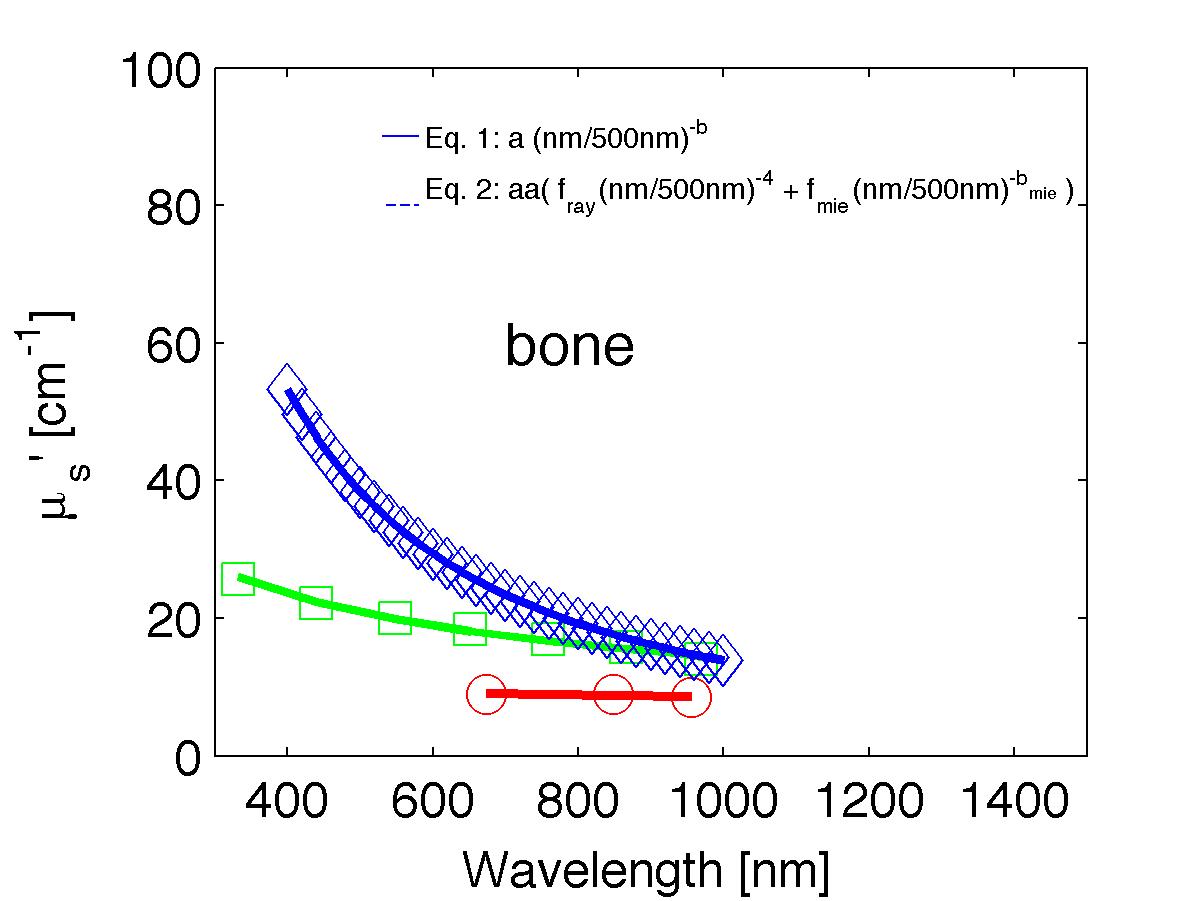
The spectra from 56 references were acquired either from published tables or from graphs, digitizing some or all the data points in the graph. The following figures show the spectra (symbols) and the fits (lines), using two equations:
Eq. 1: µs' = a (λ/500nm)-b
(shown as solid lines) where the fitting parameters are:
Eq. 2: µs' = a' (fray(λ/500nm)-4 + fmie(λ/500nm)-bmie) (shown as dashed lines) where the fitting parameters are:
|
|
|
|
|
|
|
The literature commonly describes tissue scattering using Eq. 1, µs' = a (λ/500nm)-b. Fitting with the separate Rayleigh and Mie components of scattering as in Eq. 2, µs' = a' (fray(λ/500nm)-4 + fmie(λ/500nm)-bmie), is only slightly better. However, Eq. 2 does more reliably extrapolate to shorter wavlengths below 400 nm and longer wavelengths above 1300 nm.
The key advantage to using either Eq. 1 or Eq. 2 is that data at a limited number of wavelengths can guide the prediction of scattering behavior at other wavelengths.
Table 3 lists the values of parameters that affect absorption by a tissue, i.e., blood (B), oxygen saturation (S), water content (W), fat content (F), and melanin content described as the melanosome volume fraction (M) in a 60-µm-thick epidermis. This M can be multiplied by 0.0060 cm to yield the volume of melanosomes per cm2 skin surface, which is a metric not directly tied to an assumed epidermal thickness. These parameters can scale the known absorption spectra of oxy-hemoglobin, deoxy-hemoglobin, water, fat, and melanin.
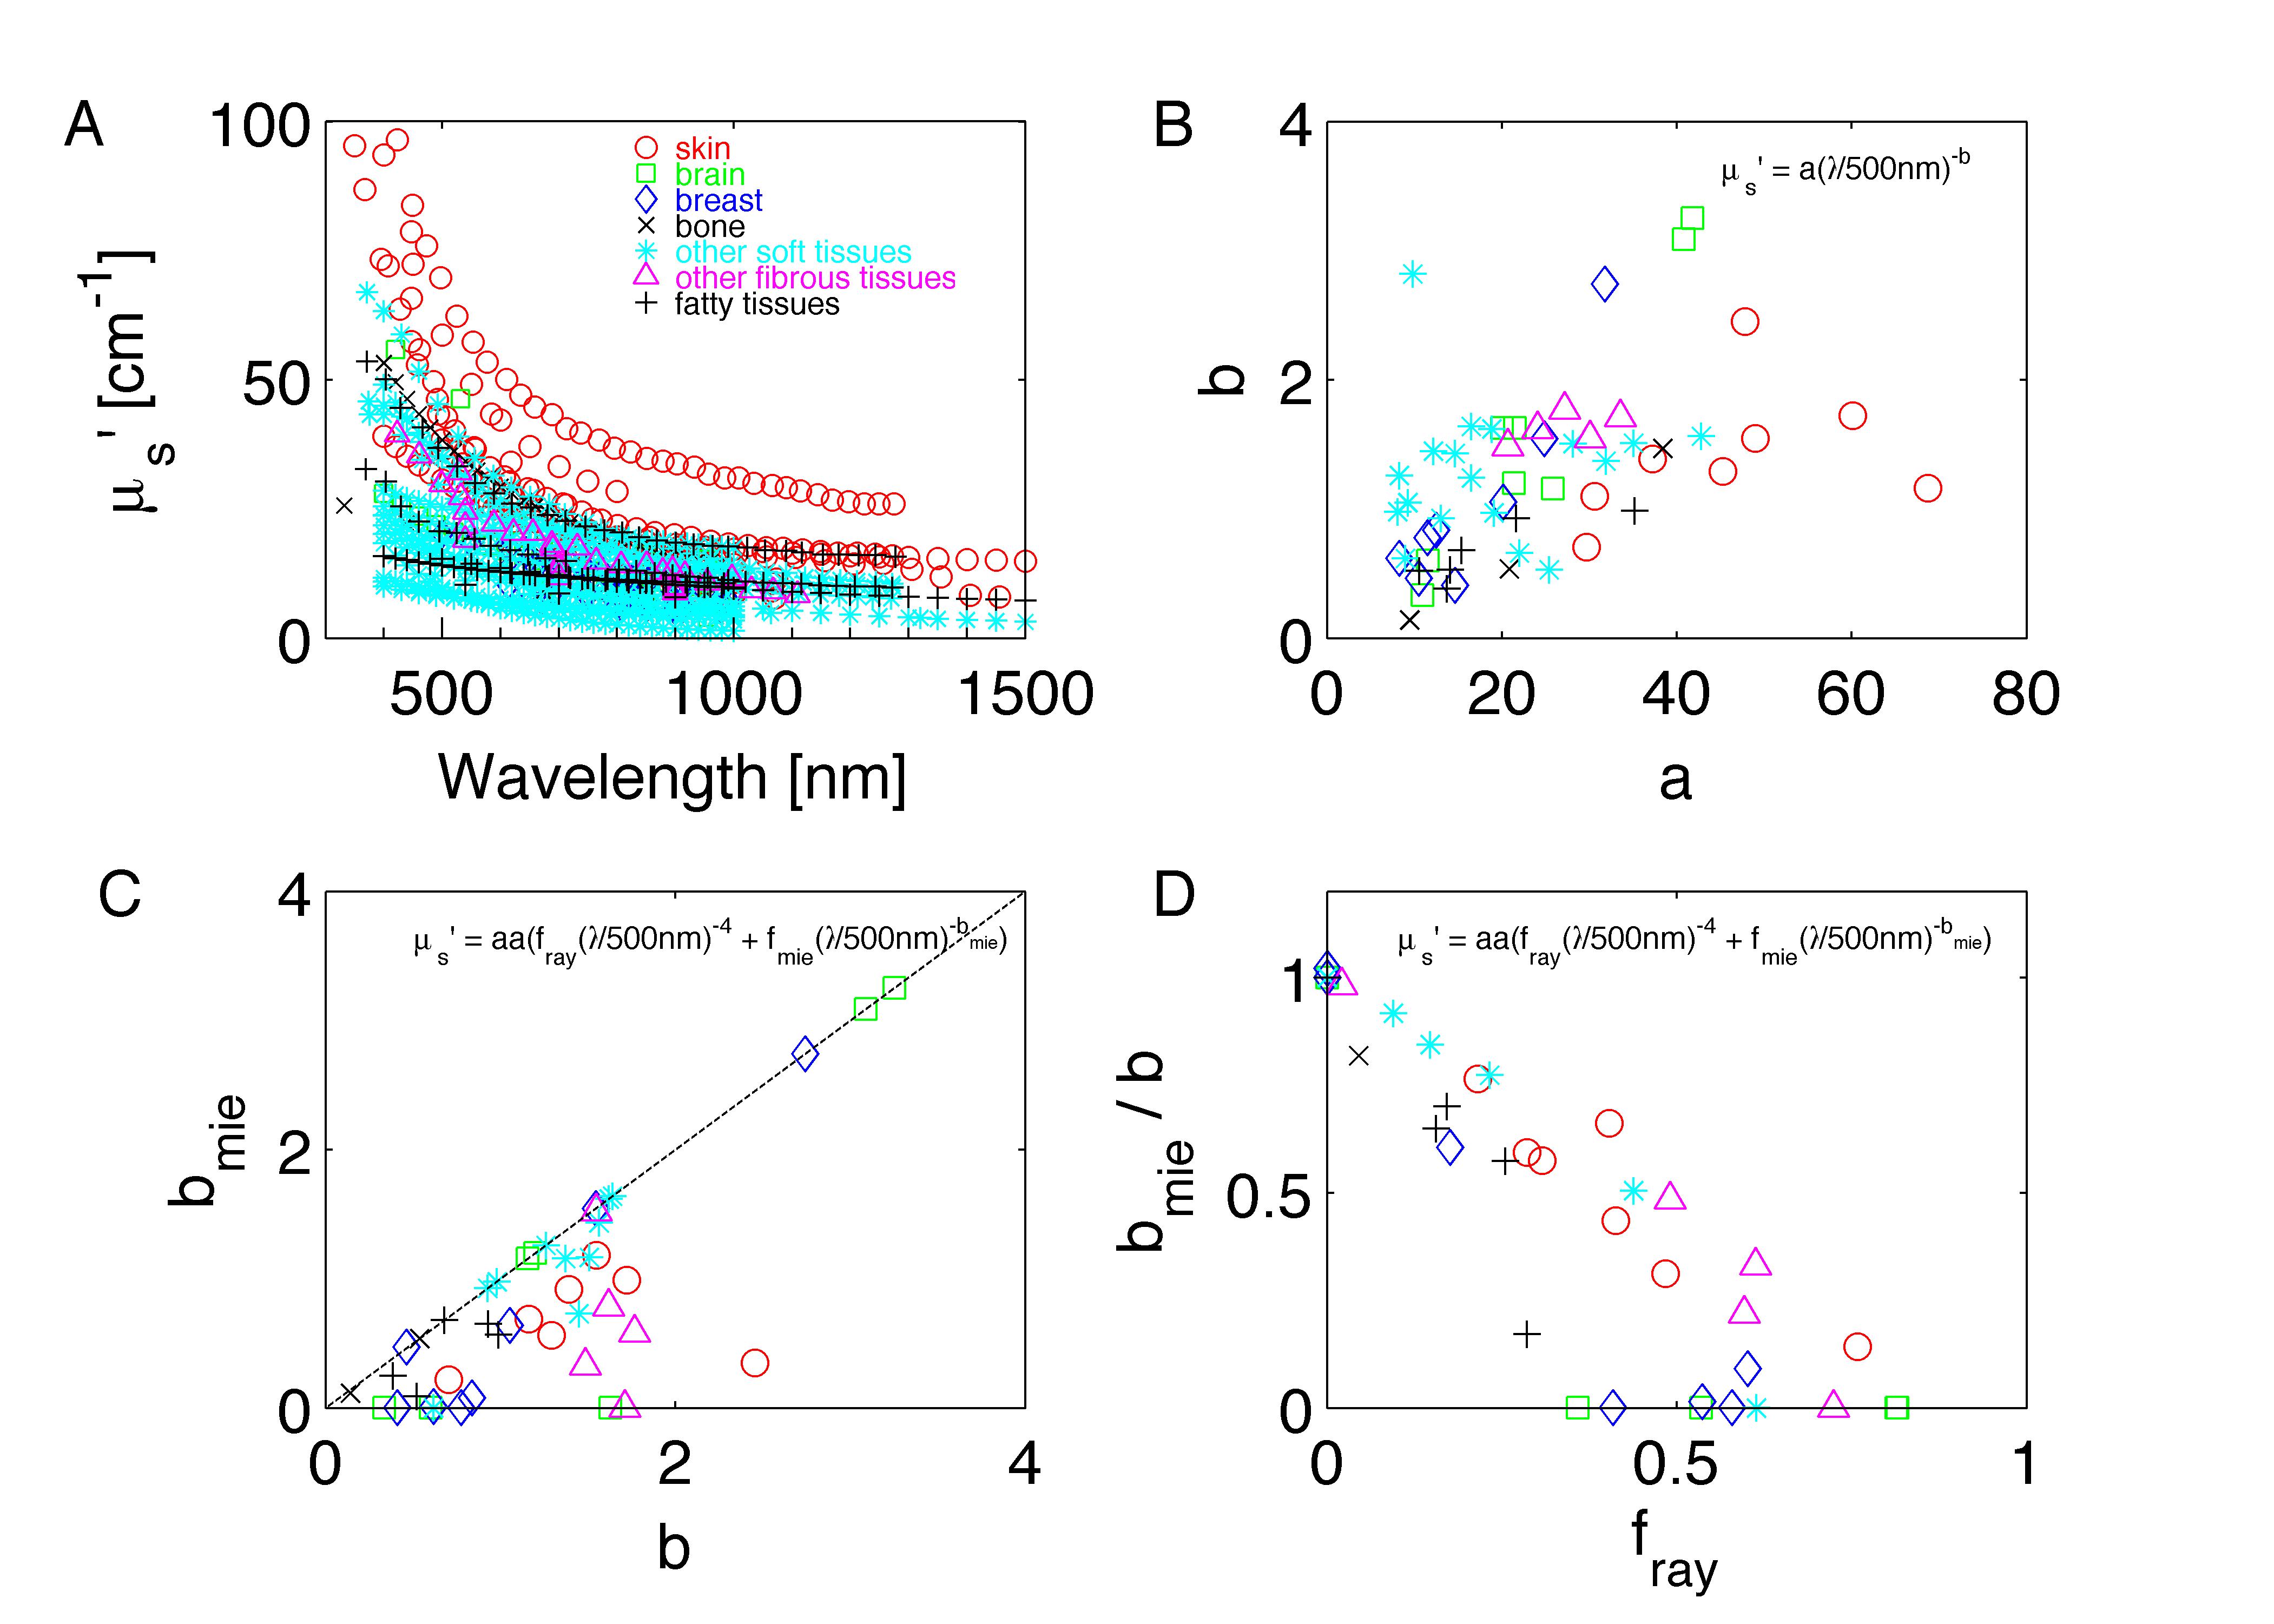
Figure A (below) shows all the spectra on one graph.
Figure B shows the a and b of Eq. 1 as b vs a. As the scattering strength increases (bigger a) the scattering power increases (bigger b). Fibrous tissues with collagen content show higher a and b.
Figure C plots the bmie of Eq. 2 versus the b of Eq. 1. While in some cases these are in agreement (along dashed black line of unity slope), bmie often falls below the dashed line (bmie < b), since Eq. 2 lets the λ-4 behavior of the Rayleigh scattering account for the rise in scattering at shorter wavelength.
Figure D shows the ratio bmie / b versus fray. As collagen content increases and more Rayleigh scattering occurs (fray increases), the b value keeps climbing to account for the rise in scattering at short wavelengths, while bmie lets the λ-4 behavior of the Rayleigh scattering account for the rise. Hence, the ratio falls.
The optical properties of biological tissues can vary, and the successful measurement of these properties can also vary. Optical property measurements can be frustratingly tricky sometimes. The literature on tissue optical properties is still a bit ragged, and more work is needed. But those who have measured and published values for tissue optical properties have succeeded in defining the approximate range of property values for various types of tissues, which is a great aid to those who are developing novel optical devices or therapeutic protocols.